
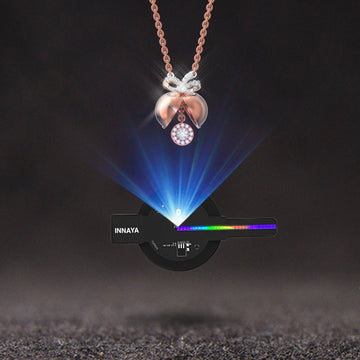

A customer stops to look at your hologram display. That is encouraging. What happens next is the part worth measuring: do they ask about the featured item, walk toward it, scan a nearby sign, or carry on?
You do not need an elaborate analytics system to start learning. This one-week plan gives a small shop or event team a manageable way to compare two display messages. It is a planning framework, not a promise of higher sales or a substitute for a controlled study.
Choose one question before making the animation
Pick an action the display can reasonably support. For a boutique, it might be more conversations about one featured collection. For a café, it might be visits to the page explaining a seasonal drink. For a trade-show booth, it might be requests for a demonstration.
Write the question as a sentence: “Does a product animation or a product-plus-invitation animation lead to more questions about our new range?” Keep it specific enough that a staff member can recognize the action without interpreting a customer's intentions.
Avoid trying to measure awareness, engagement, purchases and loyalty at the same time. You can record useful observations, but choose one primary result before the test begins.
Build two versions with one meaningful difference
Call them A and B. Version A could show a rotating product visual. Version B could use the same visual with a brief, readable invitation to ask staff about it. Keep the featured product, display location, brightness setting and supporting offer consistent.
If you change the animation, price, location and staff script together, a difference in results will be difficult to interpret. Save broader redesigns for a later test.
For the creative work itself, use our hologram content preparation guide. Check the finished files on the actual display from a normal viewing position. What looks clear on a laptop may need a simpler layout in the shop.
Make the next step easy to find
Pair the animation with something practical: the featured product nearby, a clearly written countertop sign or a staff member who knows the offer. If you use a QR code, put it on a stable printed sign and test it with ordinary phones at the intended viewing distance. Do not make scanning a moving animation the only route to the information.
A dedicated destination can help distinguish this campaign from other promotions. For businesses already using Google Analytics, Google's campaign URL guidance explains how UTM parameters identify referral campaigns. Use consistent source, medium and campaign names, with a content value for each version if needed.
Test the complete journey before launch: scan, landing page, relevant information and contact or purchase option. A scan is a visit signal, not proof of a sale. Analytics also depends on the site's implementation and consent settings, so expect differences between your manual counts and the dashboard.
Days 1 and 2: establish the routine
Use the first day to prepare the files, signs and recording sheet. Choose observation windows the team can actually cover, such as two 20-minute periods each day. Avoid claiming all-day performance from a few short samples.
On the second day, practice recording during normal trading. Agree what counts as an opportunity to see the display and what counts as the target action. For example, count a question about the featured collection once per customer interaction, rather than once per sentence.
Record aggregate counts. You do not need customer names, photos or personal details for this exercise.
Days 3 through 6: alternate fairly
Run A and B in comparable time blocks, switching their order so one version does not always get the busiest period. Keep a simple sheet with:
- Date, time window and version shown
- Minutes the display was actually operating
- Counted opportunities to see it, using your agreed rule
- Counted target actions
- Notes on weather, queues, staffing, stock shortages or other promotions
Check that the correct file is playing at the start of each block. If the device is off for half the period, flag the block rather than quietly comparing it with a full run. Keep the same observation method throughout.
Use the display only in a safe installation appropriate to its model and the location. Follow the supplied mounting and protective-enclosure instructions, keep moving components inaccessible, and leave customer routes clear. Never move a running fan to improve a test result.
Day 7: look at rates and limitations
Compare the target actions with the counted opportunities, rather than looking only at totals. In a hypothetical example, A produces six questions from 100 opportunities and B produces eight from 200. B has more questions overall, while A has the higher observed question rate. Both facts matter.
Small samples fluctuate. A one-week pilot cannot prove that the display caused a change, especially if traffic, weather or promotions varied. If there were only a few actions, treat the result as a reason to continue learning rather than declare a winner.
Read the notes alongside the numbers. Did customers understand the invitation? Was the featured item available? Did one version require too much explanation? Those observations can suggest the next single change to test.
Leave with one decision
Choose a practical next step: keep the clearer invitation, simplify the visual, improve the supporting sign or repeat the comparison over a longer period. Archive the two files and your sheet so the next campaign starts with what you learned.
If you are still choosing hardware, browse INNAYA's hologram fan range with the actual placement and viewing distance in mind. A useful campaign starts with a clear job for the display, then checks whether people take the next step.
Cover image: contextual photograph of web analytics on a tablet, not a customer installation.